What is the C4 model?
The C4 model was created by Simon Brown. It gives teams a small, shared set of words and four zoom levels for drawing software. Each level answers a different question for a different reader.
The four Cs are Context, Container, Component and Code.
The four levels
1. System context
Question: what is this system, who uses it, and what does it talk to?
One box for your system, plus the people and outside systems around it. No tech details. Anyone in the company should understand it, including sales and support.
2. Container
Question: what are the big running pieces inside the system?
A "container" here is anything that runs or stores data on its own: a web app, a mobile app, an API, a database, a queue. (It's not a Docker container, though it might run in one.) This is the level most engineers find most useful.
3. Component
Question: how is one container built inside?
Zoom into one container and show its main parts: controllers, services, repositories. Draw this only for containers where it helps.
4. Code
Question: what classes or functions make up one component?
Most teams skip this level. Your IDE already draws it, and it goes out of date the moment someone commits.
Supporting diagrams
- System landscape: every system in the company on one page. The "zoomed all the way out" view.
- Dynamic diagram: numbered steps showing how a single request moves through the system.
- Deployment diagram: which containers run on which servers, clusters or cloud regions.
Common mistakes
- Mixing levels. Putting a database table next to a whole external system on the same diagram. Pick one zoom level per diagram.
- Unlabelled arrows. An arrow should say what it does ("sends orders to", "reads from") and, at container level, how (HTTPS, SQL, AMQP).
- No key. Say what colours and shapes mean.
- Drawing it all by hand, in many files. Five diagrams that each contain "Orders DB" means five places to update when it changes. This is why C4 diagrams go stale.
How to keep C4 diagrams up to date
C4 works best as a model, not a set of drawings. Store each system, container and component once, then build diagrams as views of that model. Change the model and every diagram updates.
You can do this with code (Structurizr's DSL is the classic example) or with a visual modelling tool. Keystone is the visual kind:
- Each box is an object in one shared model. Rename it once, and every diagram follows.
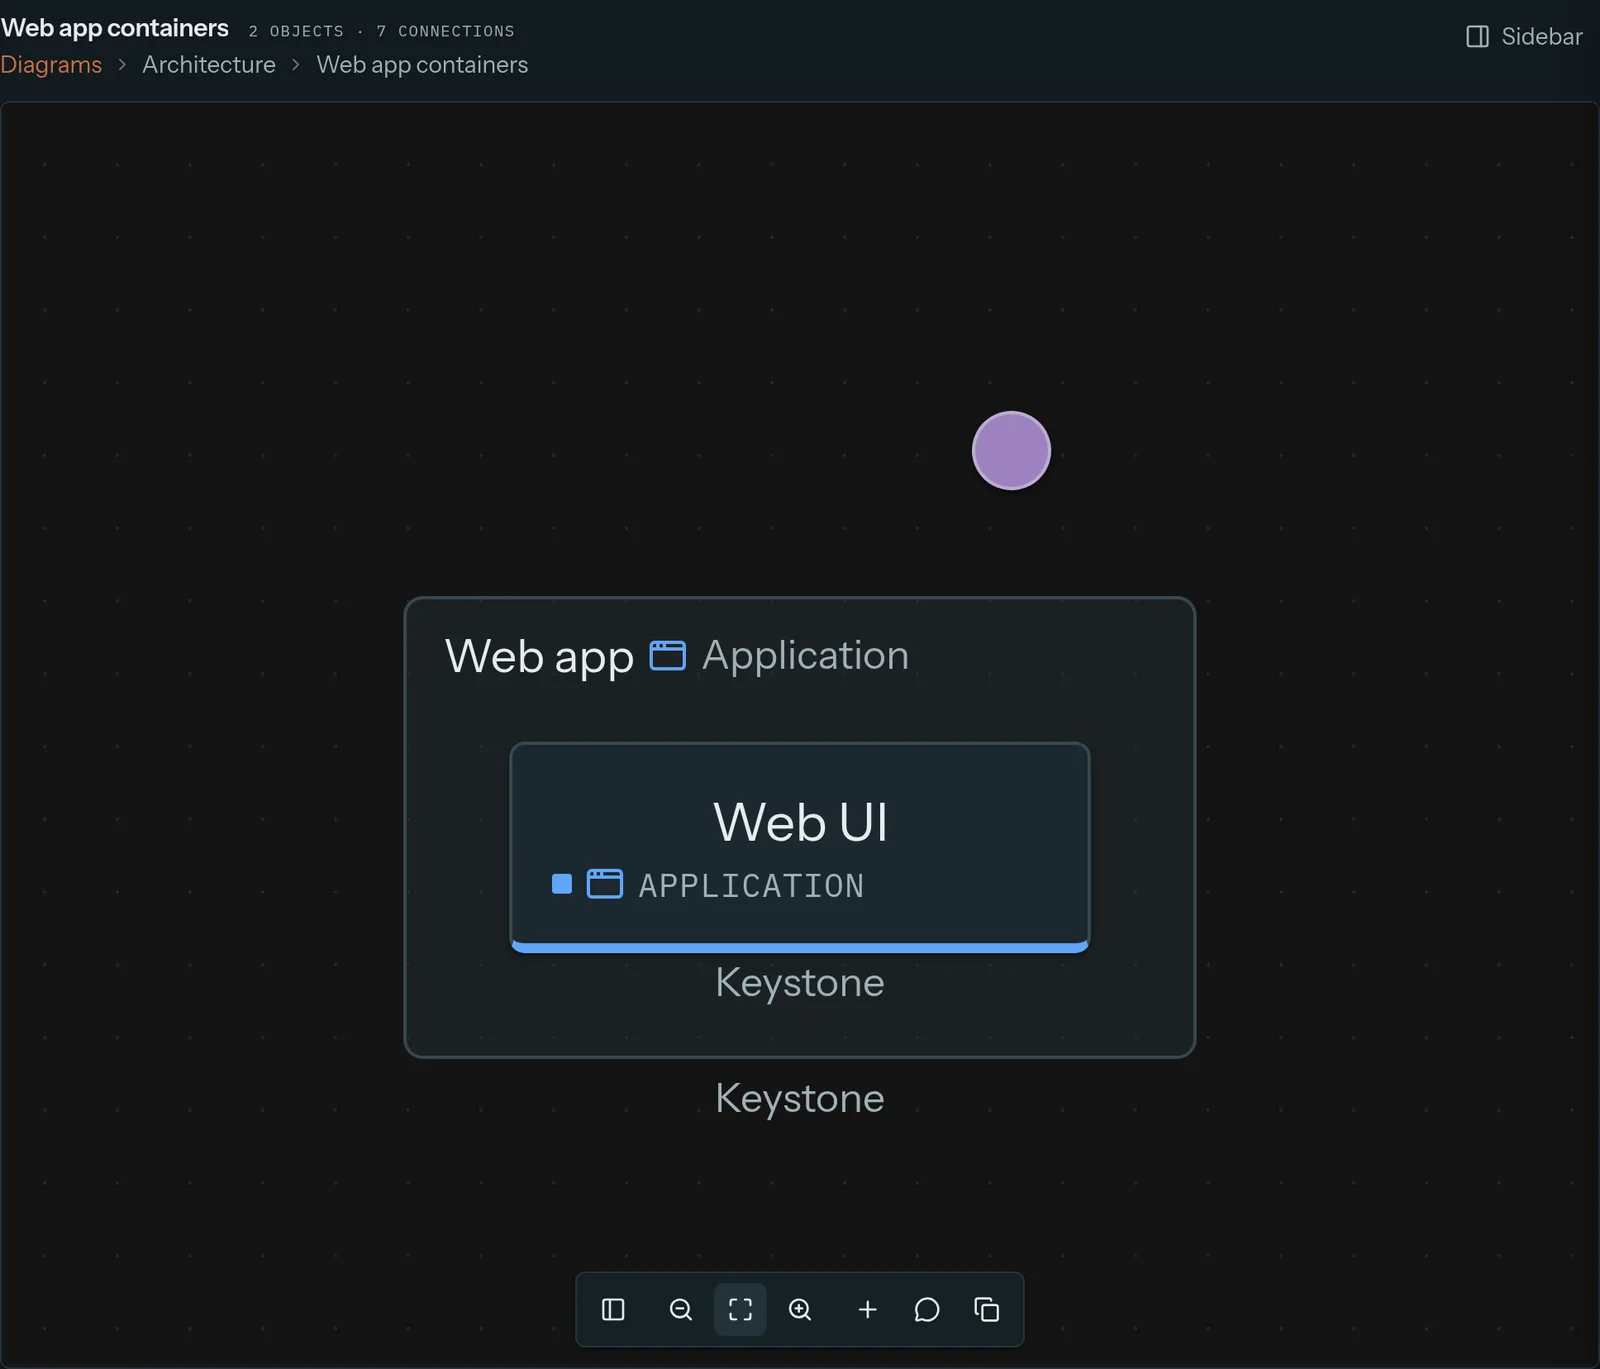
- Objects nest to any depth, so context, container and component diagrams are just different zoom levels of the same thing, like the demo above.
- Flows replace hand-numbered dynamic diagrams, with playback and alternate paths.
- Your own object types are allowed when C4's four levels don't fit how your company talks.
- Then go past C4: simulate traffic through the model to find bottlenecks.